When analyzing the market trying to get a handle an where it’s headed, there are a number of data points that I find valuable. This effort is ongoing. When searching for a client selling or buying, I have to get more specific to their situation, the property, and expectations.
One of these metrics alone may be a nice sound bite but one doesn’t tell the story or predict where we might be going. It’s through the collection of data and opinions that we find the truth. Another point, looking a just one week or month tells us very little. It’s the comparison and charting that gives us the most direction.
What you see above and why:
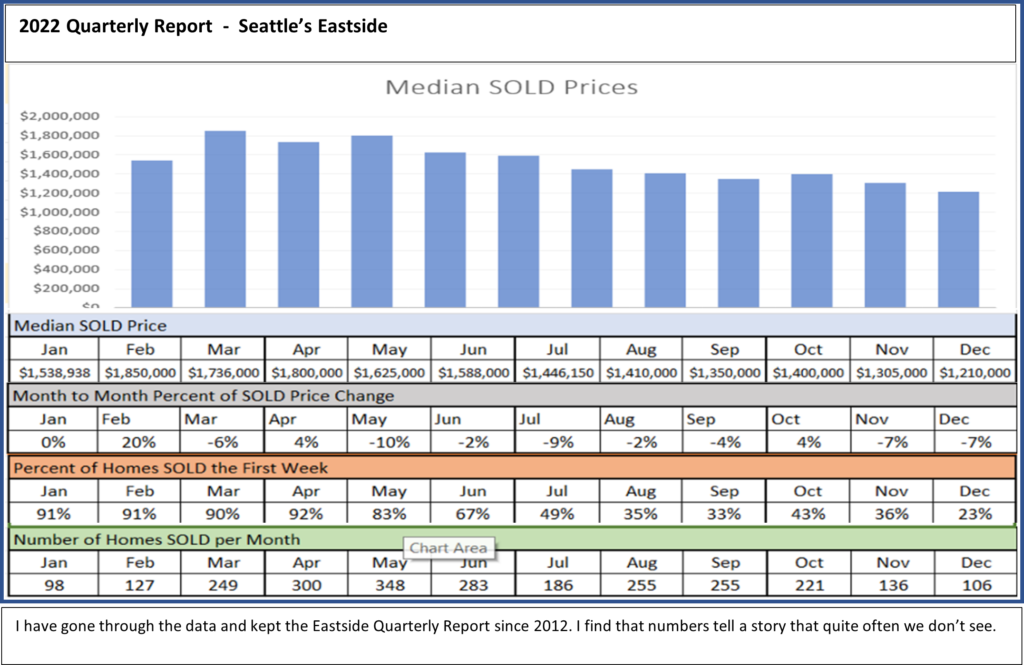
Median SOLD Price and the Percentage of Change: I keep track of the SOLD prices monthly, quarterly and if the market is changing quickly, we look at weekly numbers. Obviously, we see the direction of the market.
Percentage of Homes SOLD the First Week and Number of Homes SOLD Each Month: This tells the urgency in the market. This number can be affected by complacent buyers and an overpriced market.
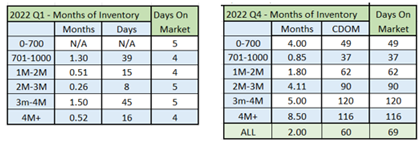
Months of Inventory and Days on the market: These are 2 numbers missing from the equation. This gives us an idea of the volume of homes buyers have to look at and the heat of the market.
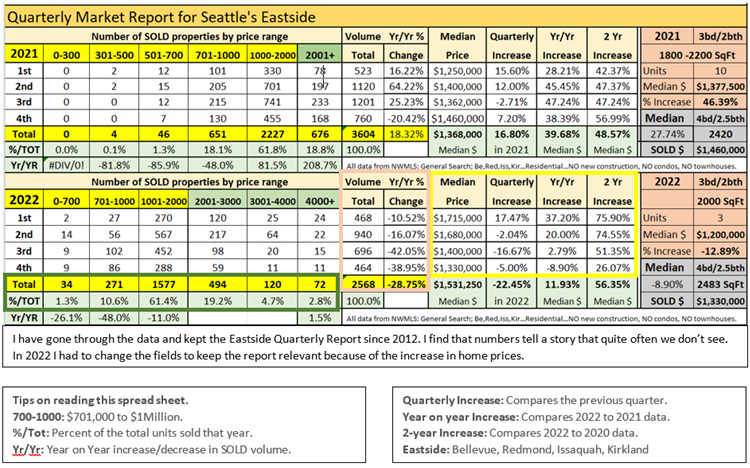
All data from NWMLS searches and compiled by Tom Perry – Realty Executives Brio.
Be, Red, Iss, Kir – Residential-No New const-No condo-No townhouses
Months Of Inventory Report
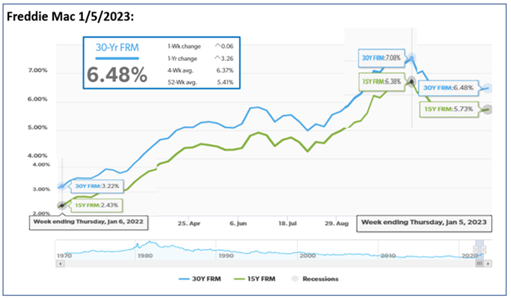
Interest Rate Report
Summary of the Year Report
Year End Numbers Report
Check REX2020.com for more blog posts and information about the market and strategies for sellers and buyers. This information is valuable and timely for today’s real estate market. Let me know if you have been thinking about a move … its always best to plan ahead.
While on my website, you can see my step-by-step processes for Sellers and Buyers. Both are based on the current market and proven by my years of experience. You can also See a few testimonials from past clients. Contact me directly to schedule time to meet with me to discuss your needs and expectations. Whether it’s time to buy now or in the future, you will receive options that will help you to put a plan of action in place. Contact Tom Directly
Not all agents are REALTORS®. We are held to a higher standard. Beyond the education, we are held accountable to the Code of Ethics. Always ask, are you a REALTOR®?